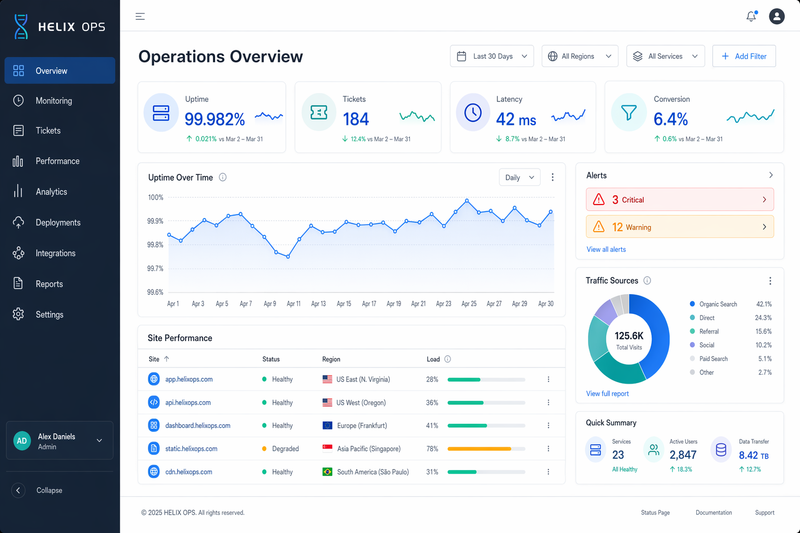
高科技企业 KPI 演示 Slides
Prompt
{
  "type": "corporate presentation slide",
  "theme": "high-tech, futuristic, dark mode, glowing neon blue and purple accents, abstract digital particle wave background",
  "header": {
    "title_primary": "{argument name=\"main chinese title\" default=\"业务影响\"}",
    "title_secondary": "{argument name=\"main english title\" default=\"Business Impact\"}",
    "tagline": "{argument name=\"tagline\" default=\"用数据说话,用结果证明价值\"}"
  },
  "layout": {
    "left_section": {
      "type": "line chart",
      "title": "效率与产能提升趋势",
      "y_axis": ["0%", "100%", "200%", "300%", "400%", "500%", "600%"],
      "x_axis": ["Q1", "Q2", "Q3", "Q4", "现在"],
      "lines": [
        {
          "label": "交付效率 (相对值)",
          "color": "neon blue",
          "trend": "upward curve",
          "annotation": "效率持续提升"
        },
        {
          "label": "单位成本 (相对值)",
          "color": "neon purple",
          "trend": "downward curve",
          "annotation": "成本显著下降"
        }
      ]
    },
    "right_section": {
      "type": "kpi grid",
      "count": 4,
      "arrangement": "2x2 grid",
      "cards": [
        {
          "icon": "rocket",
          "title": "效率提升",
          "value": "{argument name=\"kpi 1 value\" default=\"+120%\"}",
          "subtext": "交付效率显著提升"
        },
        {
          "icon": "coins with down arrow",
          "title": "成本降低",
          "value": "{argument name=\"kpi 2 value\" default=\"-200%\"}",
          "subtext": "单位交付成本下降"
        },
        {
          "icon": "bar chart with up arrow",
          "title": "产能提升",
          "value": "5倍",
          "subtext": "团队整体产能跃升"
        },
        {
          "icon": "people group",
          "title": "覆盖团队",
          "value": "10个",
          "subtext": "业务团队规模化受益"
        }
      ]
    }
  }
}- Category
- Charts & Infographics
- Model
- GPT Image 2
- Creator
- 秋风_irwin
- Source ID
- 14011
- Published
- Apr 17, 2026
Views5